Table of Contents
Running a medical practice without an accurate Profit and Loss (P&L) sheet is like trying to perform surgery without an operating microscope. You may still function day-to-day, but you’ll miss critical details that determine whether your practice thrives or stalls.
The P&L sheet isn’t just a bookkeeping report for your accountant, it’s a decision-making tool. It reveals whether you’re running lean, overspending, or holding back growth opportunities.
In this article, we’ll cover the target percentages for major categories in an ophthalmology practice and show how those numbers can guide real-world decisions, like moving to a larger office or increasing marketing.
Why Benchmarks Matter
Every practice is unique and there are many variables: urban vs. rural, heavy in surgery vs. optical, and more. There are industry benchmarks that serve as guardrails. Think of them as the normal ranges in lab results. If you’re within range, things are healthy. If you’re way off, something needs adjustment.
The key is knowing where your percentages stand so you can pivot before inefficiency or missed opportunities set in.
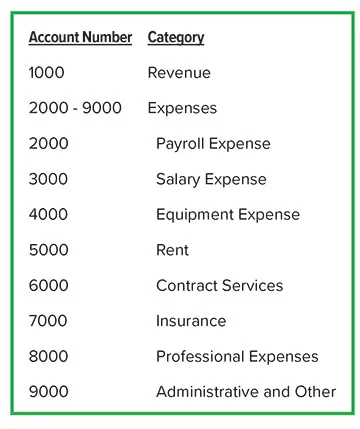
Target Profit and Loss (P&L) Metrics for Ophthalmology Practices
Here are common benchmarks for practice owners to evaluate monthly or annually:
- Rent / Real Estate Costs: 5–7% of collections
- Staff Salaries & Benefits: 20–25% of collections
- Marketing & Advertising: 3–5% of collections (may be higher in early growth years)
- Medical / Office Supplies: 4–6% of collections
- Equipment (lease, maintenance, depreciation): 3–5% of collections
- General Overhead (utilities, insurance, software, etc.): 5–7% of collections
- Owner Compensation & Profit Margin: 30–40% of collections after expenses
To be clear, These aren’t absolute numbers. They’re targets. But knowing them gives you a framework for evaluating every big decision.
Using the Profit and Loss: Rent In Context
At 2.5 years into practice, my rent is about 4% of collections. That’s comfortably below the upper benchmark of 7%. On paper, this looks excellent, right? Low overhead means more margin.
But here’s the reality: my office is tight. Staff are working in cramped lanes, patients notice the lack of space, and growth opportunities—like adding equipment or increasing daily patient volume are capped by square footage.
The P&L shows me clearly that while my rent looks efficient, it’s actually a bottleneck on growth.
Hypothetical Scenario: Expanding Space
Let’s imagine the practice at $750K in annual collections (we are growing, this is not a fully mature practice yet).
- Current rent: 4% of collections → efficient but limiting.
- New location: rent rises to 6-10% of collections → still inside the healthy 5–7% benchmark, but really pushing it
On the surface, that’s a higher expense. But here’s where the P&L flips the narrative:
If the larger office allows me to see just 3 -4 more patients per day, the additional collections could more than cover the rent increase. In this way, rent becomes less of a fixed expense and more of a strategic investment in growth and patient experience.
Marketing: From Expense to Revenue Engine
Industry standards place marketing at 3–5% of collections. In growth mode, pushing beyond that temporarily can accelerate volume.
For example:
- If marketing is at 3%, you may only have a basic digital presence.
- Increasing to 5–6% with targeted ads, stronger online reviews, and visible signage could bring in enough new patients to create a positive return.
A P&L sheet makes these calculations clear: instead of wondering if marketing “feels expensive,” you can measure whether the percentage aligns with growth goals.
Staffing: The Largest Variable
Staffing is usually the single biggest controllable line item, typically 20–25% of collections.
- If you’re under 20%, you may be lean but running the risk of bottlenecks and burnout.
- If you’re over 25%, you may need to ask whether staffing levels align with patient volume.
For instance, adding a new surgical counselor or a second technician may push staffing costs up by a percentage point—but if that addition allows the physician to increase surgical throughput, the revenue gain can outweigh the added expense.
This is why it’s dangerous to judge staffing costs in isolation. The P&L percentage puts it in perspective.
Using The PRofit and Loss to Evaluate Rent
Let’s talk about this hypothetical situation.
Imagine a well run office that is limited on the number of exam lanes possible. The rent is cheap because the office is small. But due to the limitation of space, the office can only collect 750K per year.
You want to see more patients, but it’s physically very challenging. The waiting room is cramped. The exam lanes are always filled with patients.
If you spend about 3K per month in rent. That equates to 36K per year.
If you collect 750K per year, then you are about 4.8%. That’s really good, IF you only look at the profit and loss numbers in isolation. But we know this office has potential for more.
But now, let’s say you move into a place that is much bigger, and your rent is 80K.
If you remain stagnant and collect 750K, your rent is about 10.6% which is much higher than the benchmark.
This initially seems scary. But, if this new location is closer to your referrals, or let’s say at a hospital office complex where you expend more visibility and referrals based on proximity, and you push to 1 million in collections or even 1.2 million in collections, now that rent is much more tolerable.
With 1 million in collections, you are at 8%.
With 1.2 million in collections, you are at 6.6%.
So in this case, if you are in a situation where you are in a small office, and you are evaluating a larger space, you really have to ask do I think this new rental location will allow me to see more patients? If the answer is yes, definitely consider going to a new office as a good investment.
3 Areas to Assess on your Profit and Loss, NOW
The power of a P&L sheet is that it gives you a dashboard for decision-making. Instead of being afraid of bigger expenses, you can model whether those expenses stay inside healthy ranges.
- #1 Rent – Is it too high or too low? If low, it may signal limited capacity or poor visibility.
- #2 Marketing below target? You may be under-investing in growth.
- #3 Staffing above target? Time to review efficiency and patient flow.
When viewed through percentages, the P&L isn’t just about cost-cutting. It becomes a tool for finding the right balance between lean operations and smart investments
Future Thoughts
In the next posts, we will talk more about other ways to optimize your office to plan for growth
Starting up is just the first step
It’s about aggressive and tactical expansion.